Heel's Excel
Best Insights Award
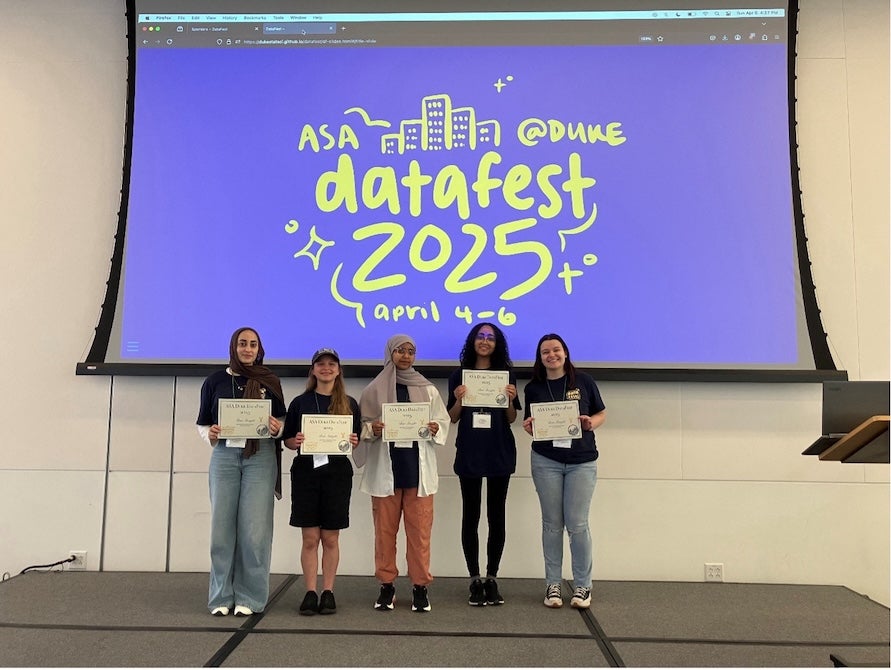
American Statistical Association DataFest at Duke
Project Overview
As part of team "Heel's Excel" at the American Statistical Association DataFest at Duke, I led the spatial analysis and mapping components of a comprehensive real estate data analysis project. Our team won the prestigious Best Insights Award, with my mapping work being specifically recognized by the judges.
Competition & Challenge
DataFest is a 48-hour data analysis competition where teams receive a large, complex dataset and must extract meaningful insights within a tight timeframe. Our challenge involved analyzing extensive real estate data to uncover patterns and trends that could inform business decisions.
Data & Methodology
Our comprehensive analysis approach included:
- Data Cleaning & Normalization: Processed large-scale real estate datasets, handling missing values, outliers, and inconsistent formatting
- Exploratory Data Analysis: Conducted thorough statistical analysis to identify patterns, correlations, and trends in the data
- Spatial Analysis & Mapping: Created detailed visualizations showing geographic patterns and clustering of real estate data
- Industry Focus: Narrowed analysis to commercial office lease data specifically for the financial services and insurance industry
- Manhattan Market Analysis: Concentrated on Manhattan real estate patterns, identifying key business districts and leasing trends
Key Findings & Insights
Our analysis revealed several critical insights:
- Geographic Clustering: Identified specific Manhattan neighborhoods with concentrated financial services activity
- Lease Pattern Analysis: Uncovered seasonal and cyclical patterns in commercial leasing activity
- Market Segmentation: Found distinct sub-markets within Manhattan's financial district
- Price Trend Analysis: Mapped rental rate variations across different areas and building types
- Industry-Specific Patterns: Revealed unique leasing behaviors specific to financial services and insurance companies
Technical Implementation
I utilized advanced data science and GIS techniques to create compelling visualizations and analysis:
- Spatial Visualization: Created interactive maps showing geographic distribution of leasing activity
- Statistical Modeling: Applied regression analysis and clustering techniques to identify patterns
- Data Storytelling: Developed clear narratives around the data insights for effective communication
- Real-time Analysis: Worked efficiently under the 48-hour competition constraint
Recognition & Impact
Our team's success was driven by the combination of rigorous statistical analysis and compelling spatial visualization. The judges specifically highlighted my mapping work as a key factor in our Best Insights Award, noting how the spatial analysis brought the data to life and revealed patterns that would have been missed through traditional analysis alone.
This project demonstrated the power of combining data science with spatial analysis to uncover actionable business intelligence in complex real estate markets.
Skills Demonstrated
This competition showcased my ability to work under pressure while delivering high-quality analysis across multiple domains:
- Rapid Data Processing: Efficiently cleaned and normalized large datasets under time constraints
- Spatial Analysis: Applied GIS techniques to reveal geographic patterns in business data
- Statistical Modeling: Used advanced statistical methods to extract meaningful insights
- Data Visualization: Created compelling visualizations that effectively communicated complex findings
- Team Collaboration: Worked effectively in a competitive team environment
Project Portfolio
Complete DataFest project portfolio
Presentation Slides
Competition presentation materials
Competition Achievement
Best Insights Award at ASA DataFest Duke
Team: Heel's Excel
Competition: American Statistical Association DataFest at Duke
Recognition: Mapping work specifically highlighted by judges
Focus: Manhattan real estate analysis for financial services industry
Official UNC Announcement
Featured in UNC Statistics & Operations Research News